Evapotranspiration of Hawaiʻi
How to cite information from this site
This website provides a set of maps of the spatial patterns of evapotranspiration for the major Hawaiian Islands. To estimate evapotranspiration, numerous other variables, such as solar radiation, air temperature, and relative humidity to name a few, had to be estimated. Those are included here, too. Most variables are mapped for each hour of the average 24-hour cycle of each month and for each hour of the average 24-hour cycle for the whole year. The average value for each month and the annual average are also mapped. In developing the evapotranspiration estimates, more than 12,000 maps were created. Many of those maps are available via this website, in the form of downloadable files and, for a selection of variables, on the interactive mapping tool.
|
Be sure to check out the interactive map! It may need a few minutes to load on your first visit. |
The Hydrologic Cycle
|
Source: Anishct (Own work) [Public domain], via Wikimedia Commons |
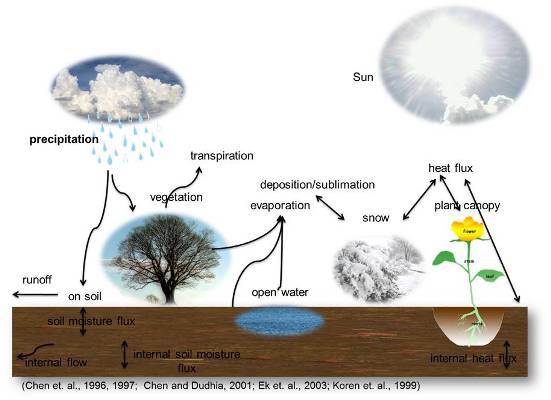
Water in our environment is cycled by processes that move and transform water. Clouds form when moist air is cooled. Precipitation happens when water drops or ice particles become big enough to fall from clouds. Rainwater can recharge soil water, groundwater, streams, rivers, and lakes. Some is used by plants, which transpire the water back to the air. And some is evaporated directly from wet leaves and soil. All the transpired and evaporated water then becomes available to form clouds and rain. This sequence is called “the hydrologic cycle” and it sustains life on earth. Understanding and quantifying the movement of water in the hydrological cycle is needed to help manage our water resources, protect our natural environment, and anticipate how climate change, land development, and species invasion will affect natural ecosystems, agriculture, and domestic water availability in the future.
|
Source: Mwtoews (Own work) [GFDL |
Evapotranspiration
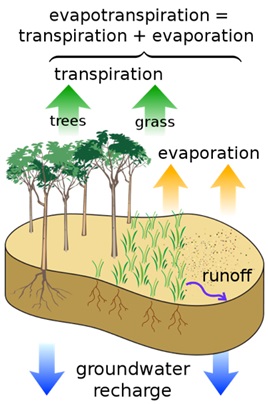
Understanding the hydrologic cycle starts with measuring and mapping rainfall. In the Rainfall Atlas of Hawai‘i, detailed analysis of rainfall data provides a comprehensive picture of the spatial patterns of rainfall in Hawai‘i. Equally important, though much less obvious and much more difficult to assess, is evapotranspiration, the combination of processes that takes water from the surface and transforms it into water vapor in the air. These processes include the movement of water through plant roots and the evaporation of that water through pores in the plant’s leaves, a process called transpiration. Water on the outsides of leaves, such as water deposited by rain or fog interception, can be evaporated, a process called wet canopy evaporation. Water can also evaporate directly from moist soil, soil evaporation. The sum of these three components is called evapotranspiration (ET).
Estimating Evapotranspiration
ET is highly variable through time and from place to place. Many variables influence evapotranspiration, including those related to climate (e.g., solar radiation, air temperature, humidity, and wind), the characteristics of the vegetation (e.g., plant type, height, density, amount of leaves, and root depth), and the properties and status of the soil (e.g., soil texture, porosity, water holding capacity, and soil moisture content). Direct measurements of ET are difficult and expensive, and cannot be done extensively enough to capture the spatial ET patterns. Therefore, it is necessary to estimate ET using models that incorporate information on the climate, vegetation, and soil factors that influence ET. More information can be found on our Methods page.
This Website
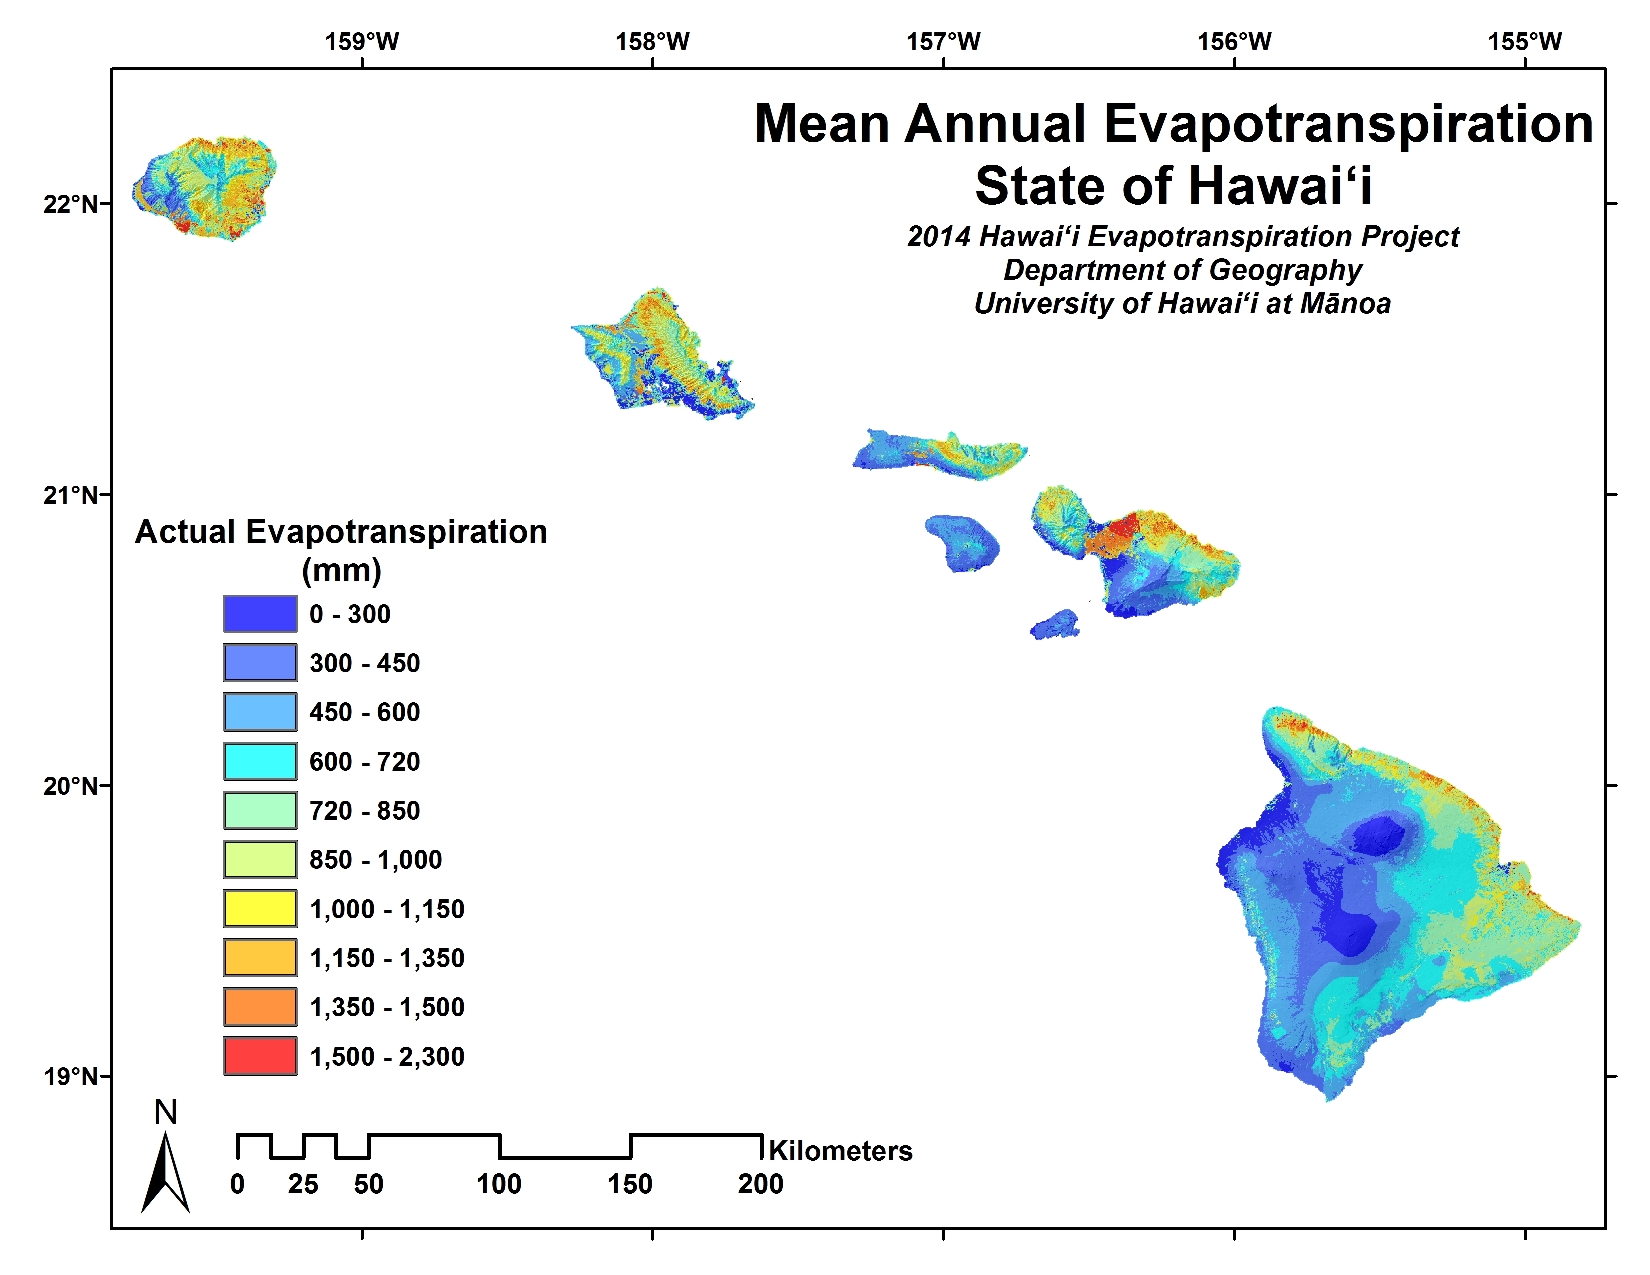
The Evapotranspiration of Hawai‘i website provides access to a set of maps of the spatial patterns of evapotranspiration (ET), its components (transpiration, wet canopy evaporation, and soil evaporation), potential evapotranspiration (PET), and the climatic and land characteristic variables used to estimate them for the major Hawaiian Islands. In general, each variable is presented in the form of mean hourly maps for each hour of the diurnal cycle of each month and of the whole year, mean monthly maps for each month, and a mean annual map. The maps represent our best estimates of the mean values of each variable based on observations taken during the past decade or two.
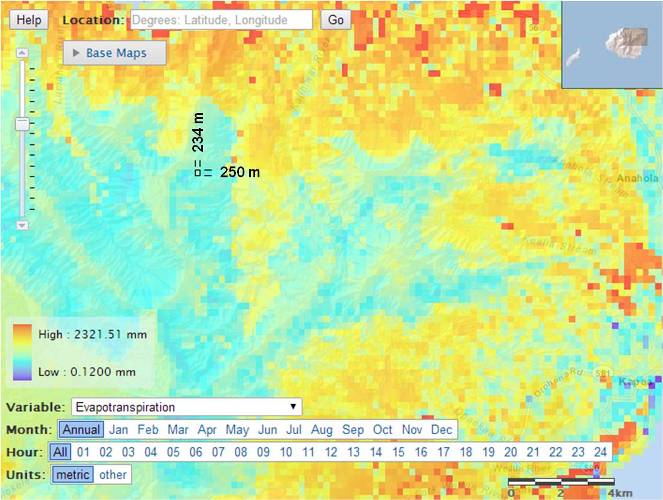
This web site was developed to make the ET, PET, and climate maps, data, and related information easily accessible. The maps depict patterns by color. The interactive map allows users to see the spatial patterns of each variable, zoom in on areas of particular interest, navigate to specific locations with the help of a choice of different base maps, and click on any location to get the mean value of the selected variable, graphs of the mean annual cycle (mean monthly values) and mean diurnal cycle (mean hourly values) of the selected variable, and obtain tables of the mean hourly, monthly, and annual values of all variables for the selected location.
ET, PET, and climate maps can also be downloaded in various forms. Our analysis produced digital maps called rasters or grids. On these maps, the islands are divided into 8.1-arcsecond spatial units, or approximately 234 × 250 m (770 × 820 ft). Each variable is estimated for each spatial unit. GIS (Geographic Information Systems) users can obtain as raster files. Alternatively, image files showing spatial patterns by color can be downloaded.
This website is part of a family of websites providing data on the climate of Hawai‘i. The Rainfall Atlas of Hawai‘i covers only rainfall. The other three websites each provide data for all variables, but each is presented with a particular focus.